Onboarding at Kroo — Tech
25 June 2020 | by Kroo Marketing Team
This blog post was accurate when we published it - visit kroo.com or your Kroo app for the most up to date information
The technology at Kroo from a new joiner’s viewpoint
At the time of writing, Kroo is pre-series A and we’re aiming to enter mobilisation (the stage before becoming a fully authorised bank) before the end of this year. Our focus now is to build the core current account functionality, and also ensure we’re complying with all FCA and PRA regulations.
The product teams are organised into vertical squads, so being in the payments squad my focus will be on everything payment related. There is currently one other squad - the accounts squad - who are responsible for everything account and customer-related.
This article will focus on the more technical aspects of onboarding, but it’s also worth mentioning that, at Kroo, our ways of working play a big part in helping people onboard successfully. For example, we use pair programming, which really helps to share knowledge and get people up to speed.
What does Kroo’s architecture look like and how does this help with onboarding?
Kroo takes a microservice approach with event sourcing. These two aspects are key to a speedy onboarding; the microservices architecture allows us to focus on just the functionality we care about for our specific task, and the events sourcing approach gives us a consistent way to think about how the system works.
At a very high level, events are triggered from either our mobile app or a third party, such as a payment provider. If triggered from the mobile app, a request is sent to a service which is solely responsible for redirecting it to the relevant service (or services).
Requests that come from third parties will go to our Amazon API Gateway, which will redirect it to a backend service directly (usually a gateway service, which again will redirect to the required services). Each of these backend services is responsible for a specific function, for example handling account top-ups.

Within my first few weeks at Kroo, I was involved in a task to integrate a new third party application to monitor transactions, which enables us to identify suspicious behaviour. Because we use microservices, this task didn’t involve going into a pre-existing code base and having to figure out which bits to change and where to add our new code; instead, it required creating a new service.
This meant that there was less risk of breaking existing functionality, and that we could spend more time writing high-quality code for the new functionality. Often what happens over time when we don’t take a microservices approach is what starts as a small, well-defined service gets additional functionality “bolted” on, making it difficult to understand, refactor or add to even for engineers that have worked with it for a long time.
How do we create a new service?
At Kroo, we have repository with a template service and a command that can be run to generate a new service from it. This will create a new repo in Github with a basic project structure, deploy the service and other infrastructure to AWS, and create a CI pipeline. The command is written using Rake, which is a Ruby tool that allows you to define tasks).
All services are created in this way, which means that they are all very similar in structure. The consistency across services makes it easy to compare code between projects. This allows new joiners to be more self sufficient as they are able to look at existing services to understand what they do, and apply the same approach to the new service.
All of the services are written in Clojure, so although this was a new language for me when I joined, I could quickly start to understand the concepts and libraries used just by looking at the existing services.
What does this new service look like initially?
Now that we have generated the new service, we’re ready to dive in and see what’s inside.
Some of the key things we get in any newly created service are:
- basic endpoints such
/healthand/ping - other endpoints to access our data, for example
/events - logging and metrics
- the ability to subscribe to topics from other services and the events processing template code
- a database and some standard functions/queries to read from or insert into this database, using HugSQL
- a Rakefile, which provides a set of standard tasks within your projects, such as a task to run all tests
This provides us with the basic structure to receive http requests from other services, to send requests, or to process and handle events produced by another service. The focus can therefore be on implementing the business logic.
If we need to make our service’s events available to other services, we’ll need to use Kafka Connect. This works by periodically polling the events endpoint, which reads from the service’s event log, stored in our service’s PostgreSQL database.
What can we do with this service?
With the functionality above we can now start to process events or handle requests. This could mean adding new endpoints and writing some business logic to handle the requests, or processing events from Kafka.
By looking at the other services we can see a standard way to process events from Kafka, using a rules-based approach whereby the rule can be determined by the Kafka topic they’re read from or any other field we have available.
To process events we created an open-source library called vent, where we can write something like
(from-channel :other-service-topic
 (on-type :some-event-type
  (act act-on-event)))
which reads from a topic called :other-service-topic , and calls a function act-on-event when it sees an event with type :some-event-type .
What’s nice about this approach, is that we can quickly see which topics the service is reading from, and in one file see how each event type is handled.
Where does the service run?
Another aspect that can often make onboarding new engineers more challenging is the question of “where is this existing service running and how do I find the logs?” or “how do I deploy my new service?”. At Kroo, this question is easy to answer as all services are deployed to AWS ECS and all the logs can be found in AWS CloudWatch.
The infrastructure is provisioned as infrastructure as code with Terraform, so it’s easy to replicate a resource and ensure consistency across the services. This is included in our template service too, so we don’t need to worry about how to deploy our new resources.
As mentioned previously, the Terraform files are included in the template service. In addition to these, we have a configuration file for the CI/CD pipeline, which, when we push to the master branch on Github, will trigger the development pipeline and deploy the service and other infrastructure we need in the development account on AWS.
Does the service work as expected?
With the service running in our development environment we can quickly identify which components might not be working as expected.
A short feedback loop is important, because we are more likely to understand what’s gone wrong if we only need to look at the code we’ve recently added, meaning we can learn quickly as we go. This is great for new joiners, who are continuously learning and putting the pieces together.
Another aspect that helps tighten the feedback loop is that we always push small changes rather than creating large pull requests. Therefore every small change (that we are fairly confident won’t break things) is deployed to development and we will see an error if there’s a problem. We can then investigate the most recent code changes and fix the bug. We can quickly learn from our mistakes, or confirm our understanding.
For metrics and alerting, we have an instance of Prometheus running, and some logging helpers in our new service. These are used in the code that’s already there, and we can use them further within the new functionality.
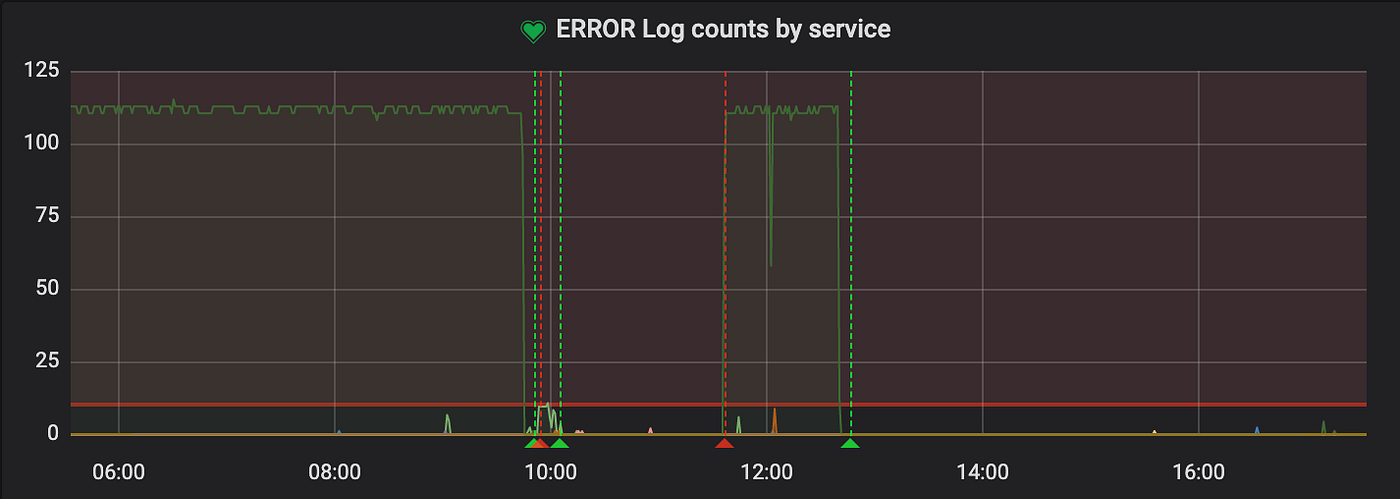
There are Grafana dashboards set up already, which show all services. Here we can see visualisations, such as number of requests to each endpoint, or counts of logs by log level (example ERROR log count by service below). We also have alerts in AlertManager, which will send alerts to Slack. This makes it even easier to spot when there might be issues with our new service.
It helps that we are pairing as this means we can be more confident with our changes before they go to the development environment, and we don’t need to have lots of different environments for each branch, because we’re always pushing to master. We don’t need to wait for asynchronous code reviews, either, to be told we haven’t considered an edge case, for example; instead, we can discuss with our pair in real-time.
What’s next?
My first month at Kroo has been a great experience and I hope this gives a sense of what it’s like to join Kroo as a developer.
This article has focussed on backend services, but all the developers here have full stack responsibilities, so other developers in their first month might have been more involved in front end development instead. For our mobile app we use React Native, and for our internal dashboards we use React.
As I hope you can see, there’s a lot of exciting stuff going on, so please check out the rest of our blog to learn more about what we do and how we do it!
If you’re interested in joining Kroo please see our careers page https://kroo.com/careers/.